Uncertainty and sensitivity analysis
Overview
 Uncertainty analyses involve the
propagation of uncertainty in model parameters and model structure to
obtain confidence statements for the estimate of risk and to identify
the model components of dominant importance. Uncertainty analyses are
required when there is no a priori knowledge about uncertainty
in the risk estimate and when there is a chance that the failure to
assess uncertainty may affect the selection of wrong options for risk
reduction.
Uncertainty analyses involve the
propagation of uncertainty in model parameters and model structure to
obtain confidence statements for the estimate of risk and to identify
the model components of dominant importance. Uncertainty analyses are
required when there is no a priori knowledge about uncertainty
in the risk estimate and when there is a chance that the failure to
assess uncertainty may affect the selection of wrong options for risk
reduction.
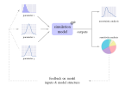
When risk estimates are used for decision-making, sensitivity analysis allows the identification of those uncertain input parameters whose uncertainty has the greatest impact on model output uncertainty. It quantifies the relative impact of various sources of uncertainty on the output variables of interest, allowing decision-makers to assess the utility of further investment into uncertainty reduction.
This submodule is a part of the risk management module.
Learning objectives
Upon completion of this submodule, you should be able to:
Understand different sources and representations of uncertainty
Know how to estimate the relative impact of different sources of uncertainty on a decision
Be able to characterize and quantify the sensitivity of different model parameters on total output uncertainty
Course material
 |
Introduction to sensitivity analysis |
 |
Python notebook on sensitivity analysis |
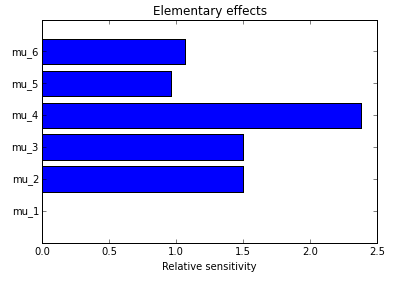 |
Python notebook on the elementary effects method |
In these course materials, applications are presented using the NumPy, SciPy and statsmodels libraries for the Python programming language. We have some material on getting started with Python that explains how to install Python on your computer or try out our computational notebooks using free online services.
Applications of sensitivity analysis include:
Risk communication: how much of my output uncertainty is irreducible (caused by aleatory uncertainty in input parameters)? How much is epistemic (related to lack of knowledge, could be reduced with more research)?
Optimize research investment to improve risk analysis: which uncertain input parameters contribute the most to model output uncertainty? On which uncertain input parameters should I spend my research money to gain the biggest reduction in uncertainty?
Model reduction: identify ineffective parameters (that have little effect on model outputs), and generate models with fewer parameters, but (almost) identical results (metamodels or response surfaces).
Methods that can be used for sensitivity analysis, from the most basic to the more sophisticated, include:
tornado diagrams, a way of presenting basic “what-if” analyses, mostly used for project risk management or basic financial estimation
screening methods, which allow you to identify, with a small number of calculations, those parameters that generate significant variability in the model’s output (and ignore the other ones for your sensitivity analysis). These are mostly “one at a time” (OAT) methods, which consist of varying one parameter at a time, ignoring interaction effects between parameters.
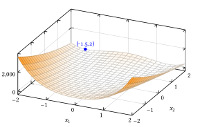
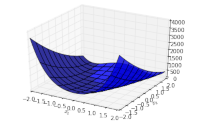
local sensitivity analysis techniques, which analyse response stability over a small region of inputs, simply by estimating partial derivatives of the response surface around that point.
global sensitivity analysis methods that allow you to examine the effect of changes to all input variables simultaneously and over the entire input space you are interested in. Example methods include the Fourier Analysis Sensitivity Test (FAST) and the method of Sobol’. This is the most relevant method for risk analysis purposes.
The notebooks above show how to implement these methods in Python.
Other resources
We recommend the following sources of further information on this topic:
The open-source OpenTURNS software platform allows sophisticated uncertainty analyses
The open-source Dakota software platform helps analysts and decision-makers understand outcomes of predictive simulations
Published: