Correlation analysis
How are my variables related?
Overview
 Before you start to create risk models, it is a good idea to
analyze how the variables are related to one another. Examples of
questions that arise in risk analysis:
Before you start to create risk models, it is a good idea to
analyze how the variables are related to one another. Examples of
questions that arise in risk analysis:
Process safety engineer: “To what extent does increased process temperature and pressure increase the level of corrosion of my equipment?”
Medical researcher: “What is the mortality impact of smoking 2 packets of cigarettes per day?”
Safety regulator: “Do more frequent site inspections lead to a lower accident rate?”
Life insurer: “What is the conditional probability when one spouse dies, that the other will die shortly afterwards?”
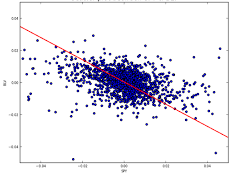
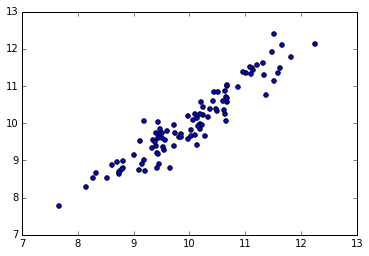
The simplest statistical technique for analyzing causal effects is correlation analysis. It measures the extent to which two variables vary together, including the strength and direction of their relationship. Exploring correlation between variables is an important part of exploratory data analysis.
Learn how to measure the degree of linear dependency between two random variables using Python and the SciPy library. The lecture slides include a number of warnings related to dependency, causality and correlation in risk analysis.
This submodule is a part of the risk analysis module.
Course material
 |
Modelling correlations with Python |
 |
Python notebook on correlation |
In these course materials, applications are presented using the NumPy, SciPy and statsmodels libraries for the Python programming language. We have some material on getting started with Python that explains how to install Python on your computer or try out our computational notebooks using free online services.
Other resources
We recommend the following sources of further information on this topic:
Analysis of the “pay for performance” (correlation between a CEO’s pay and their job performance, as measured by the stock market) principle at Freakonometrics
Python notebook on a more sophisticated Bayesian approach to estimating correlation using PyMC
Exploratory computing with Python, a set of Python notebooks on analyzing data using NumPy/SciPy
Published: